Louis getting started with PowerBI
In early 2023, Louis joined us as a data trainee. As his first assignment, he took an on internal challenge: the creation of a marketing dashboard. Curious about his assignment approach and learnings? One thing is sure, it’s about more than data visualization. So chop chop, read on to discover what we mean.
“Even though, we might think a dashboard is about visualization, in this case, it was mostly about data engineering.”
His assignment

The past year, the marketing team invested a lot in the marketing strategy of the company. A new strategy asks for KPI’s and analytics. Since each channel has its own dashboard, the results of a campaign were spread over multiple visuals, making it hard to analyze a campaign that ran over multiple channels. That’s why they asked me to build a dashboard that combined all data sources.
The main goal and added-value of it would be the capability of cross-analysis between campaigns and results from one channel to another, offering this general perspective on how the marketing efforts are paying off.
His approach
Functional and design-setup
After several intakes on the needs of the marketing team, Louis designed mock-ups based on the KPI’s. Several versions were drawn on paper and later on, built with sample data.
Pipeline engineering (ETL) & data visualization
Research on how to set up the connections with several sources: LinkedIn, Meta, Recruitee and Hubspot. A process of trial and error and searches on Google were a big part of this step. Each time some data was successfully pulled from an API, Louis would switch to the design phase. Enabling him to showcase some progress to the stakeholders throughout the weeks.
Fine-tuning
After approaching the completion of most required visuals on PowerBI, an iterative process of improving user experience and dashboard efficiency took place. Charts designs were reworked to enhance readability and ease of use for non-technical users and queries were adapted to pull only the required amount of data, based on stakeholder’s inputs.
Inform
We guess it is pretty clear that the dashboard requires a very technical back office. That’s why Louis added a last stage to his project: documentation and tutorials to support the team in the refresh of API tokens in the future.
“Eventually, all APIs queries have been reworked so many times, in so many different ways, and even though they are not really efficient, they constitute my biggest pride about this project: I can say I’ve been able to ETL such sources and aggregate all of these together.”
His development
A data project always has two sides and Louis also believes he has grown in both: people & hard skills.
Technical skills
This assignment gave him the chance to discover PowerBI and its embedded tools (Power Query, Power BI Service and Desktop, DAX, M…) but also REST APIs and a bit of SQL. The dashboard required a lot of programming, so that’s why Louis believes his biggest learnings were in the field of data engineering:
“I gained confidence using Power BI and setting up complex queries on web APIs, which was completely new for me.”
On top of that, I learned that it is valuable to have a network with data-minded people to ask for help if needed.
People skills
On the soft side? He mainly learned more about stakeholder management. The assignment required plenty of meetings with different parties and even one-to-one meetings for specific aspects. A challenge for Louis in the beginning:
“I received the feedback that I am very independent in my work, which is fine, but I also should take more initiative to update stakeholders on the progress of the project or to ask questions when needed.”
He believes to have grown in meeting preparation, expectation management and communication. The last meaning that he learned to diverge as little as possible on the technical side with non-technical stakeholders.
His delivery
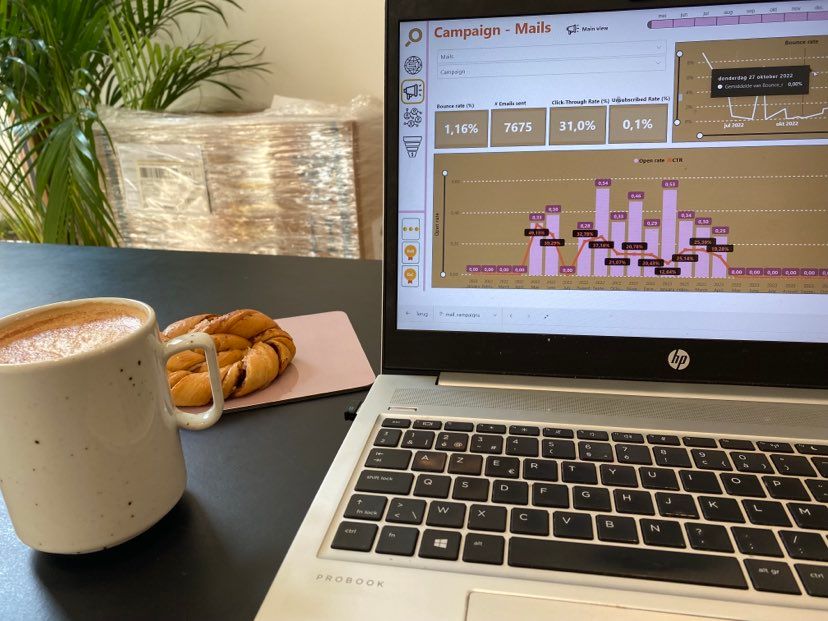
A dashboard that combines information from LinkedIn, Meta, Google Analytics and Hubspot. It displays a total of 55 visuals across 5 pages and can be used for both recruitment marketing as B2B marketing. A result created by asking a lot of feedback, to improve the dashboard and for his own motivation.
“Most parties agreed on the good use of user-friendly visuals as well as icons over text for readability. For me, it felt important to get some return on my work as I have been dealing with the technical side of the project mostly on my own; recognition and positivity go a long way in my motivation to improve further!”
Overall, Louis contributed to a faster analytical process within the marketing team. Providing them with the means to frequently report across all platforms about campaigns, website visits, … An efficient data process to support the marketing team in making better decisions about content, SEO, marketing strategy and so on.
"Louis was eager to get to the core of PowerBI in order to provide us with a solid Marketing Dashboard. He captured our specific needs well and found creative ways to adjust the dashboard accordingly. At first he used very technical language, however when we gave him feedback about this, he adjusted his communication. A win for our Marketing team!"
As passionate about data as Louis?
And eager to develop your people skills while working on impactfull data assignments? Discover our data traineeship or just connect with Louis to discuss the traineeship some more.
